![]()

Features Detail Intro
 KPI Report & Dashboard
Data analysis and workflow optimization
Visualize progress and KPIs using data from PORTERS, identify bottlenecks, and streamline your workflow.
Key Features
01. KPI Report
You can generate and download visualized KPI reports on any metrics you want to track. You can view both the latest and past phase histories, making it easy to visualize pass rates and progress by the assignee with just one click.
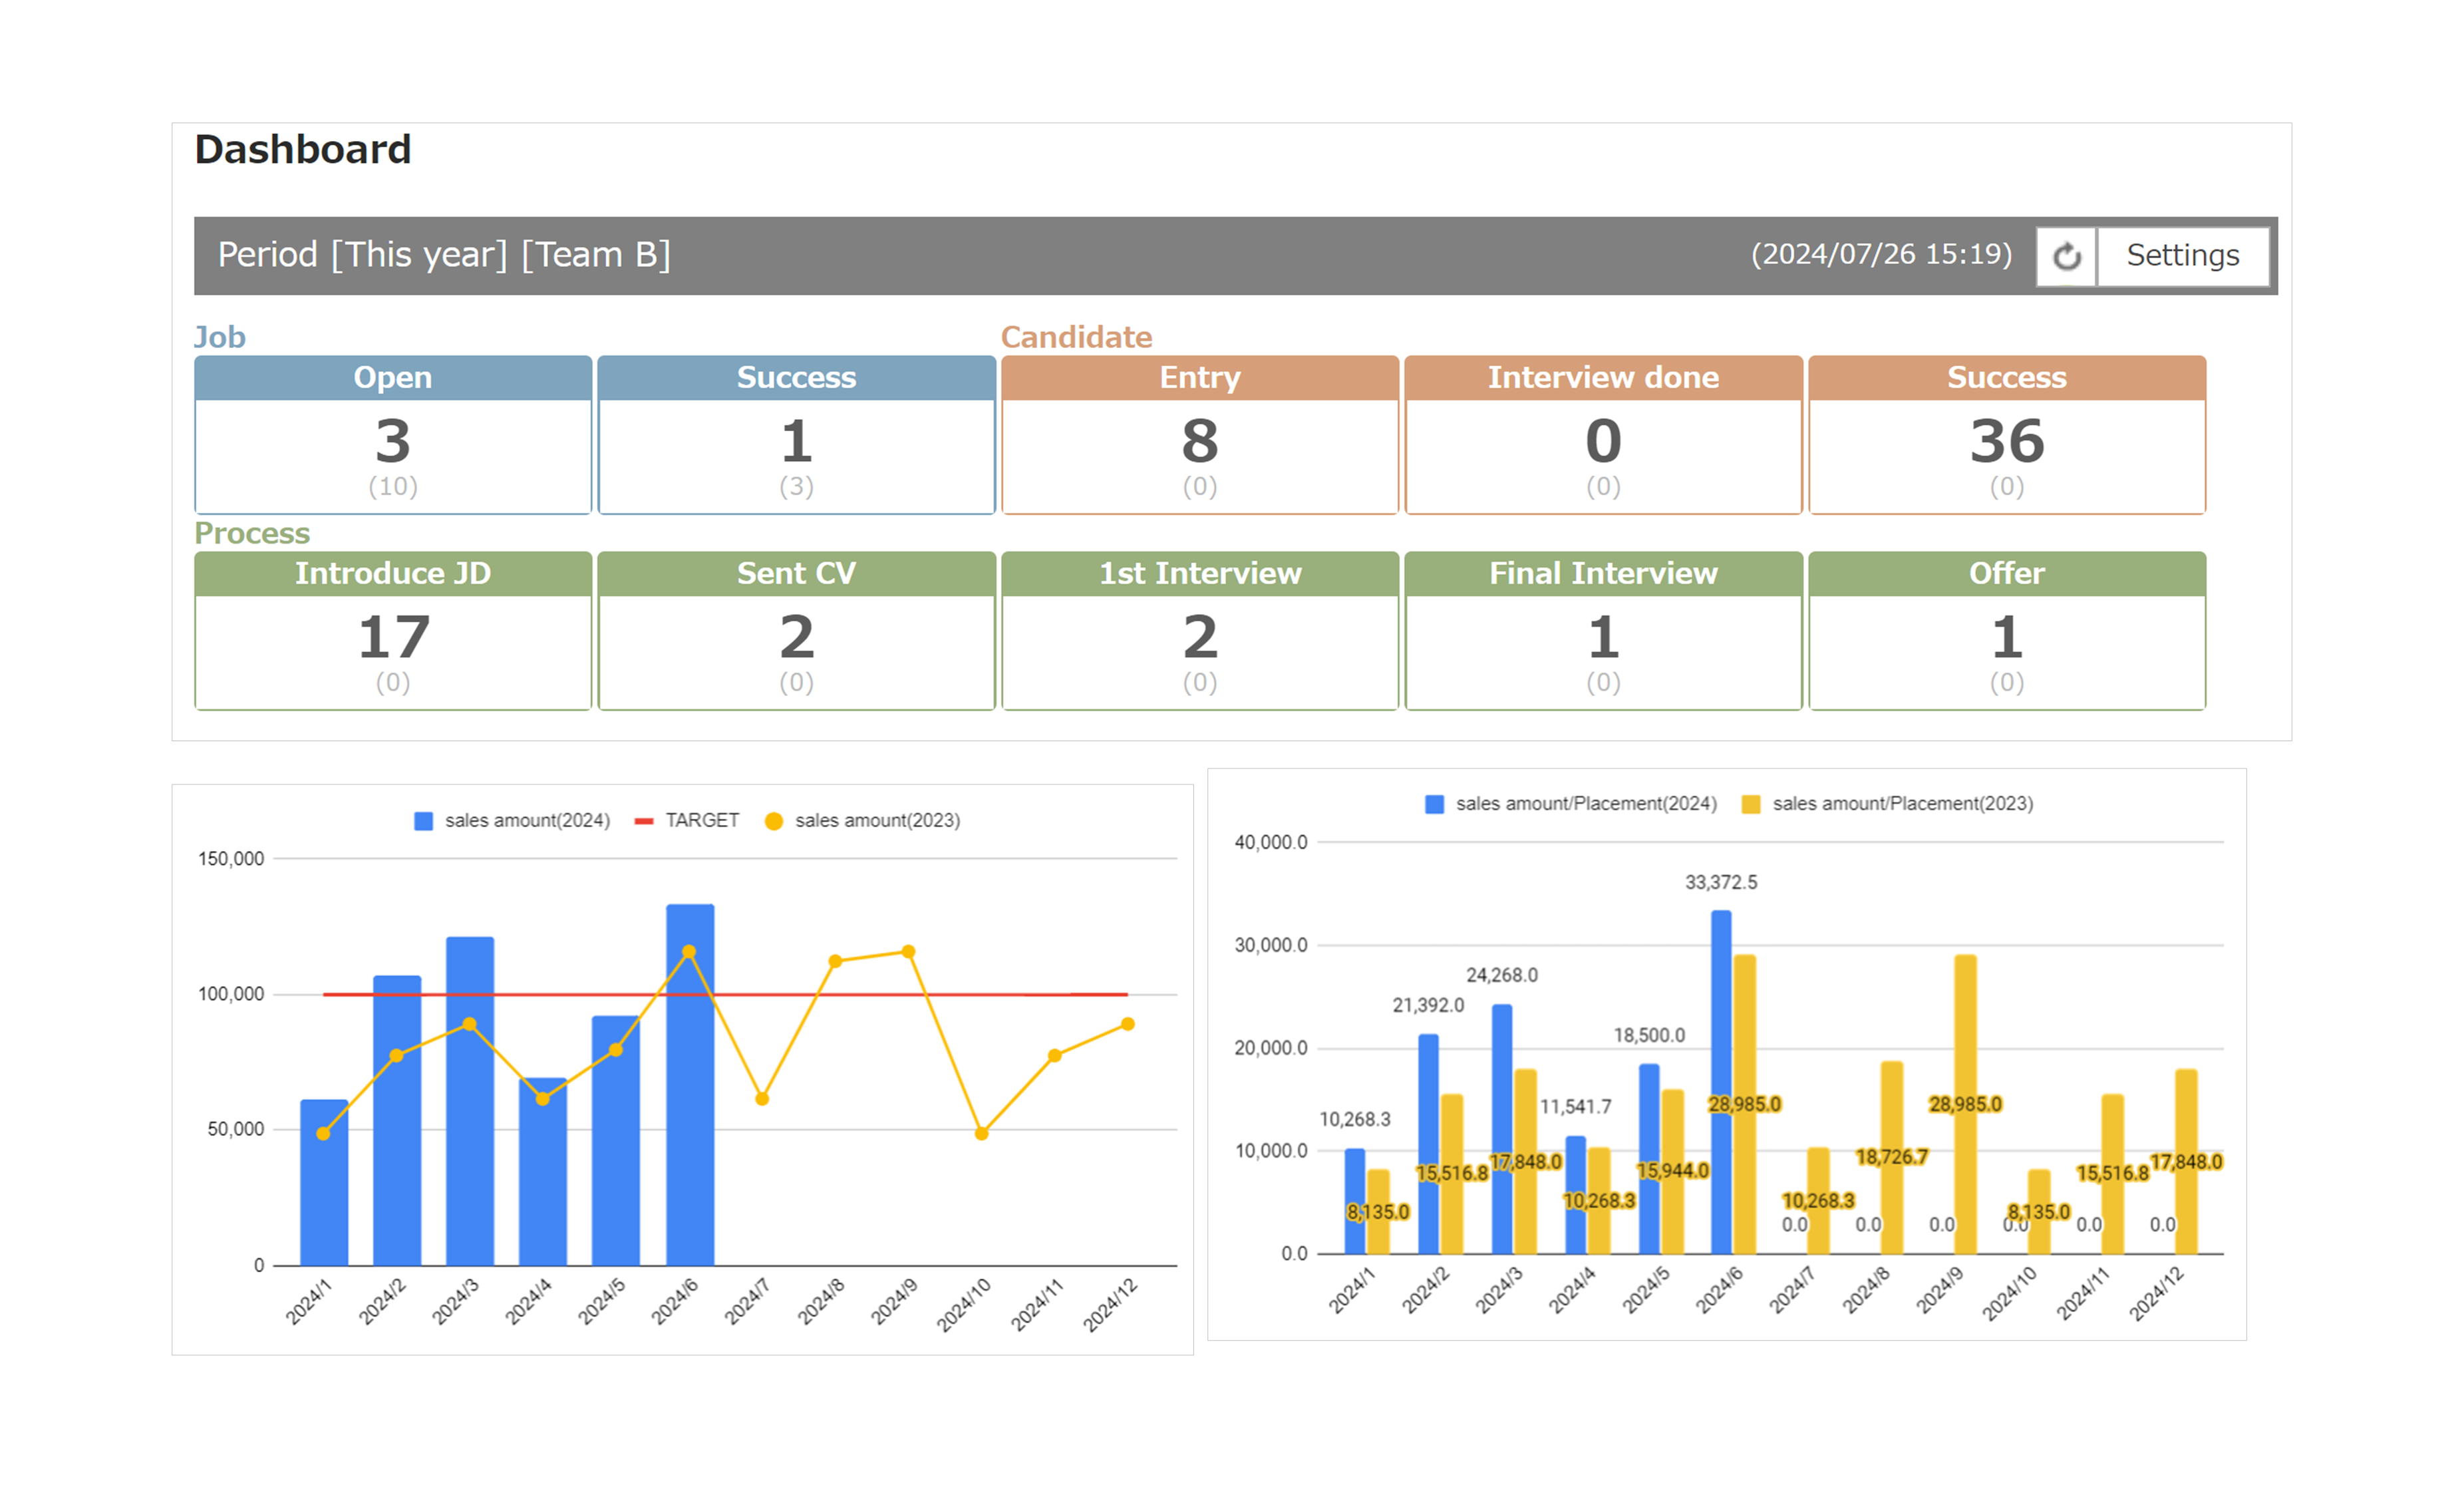
02. Dashboard
It automatically tallies the progress at each phase, constantly visualizing recruiting performances.
Key Advantages
-
01. Proactively identify and address bottlenecks.
It analyzes data from any timeframe and category, enabling you to identify bottlenecks in a timely manner.
-
02. Speed up the decision-making
Real-time KPI visualization enables you to make decisions and take action quickly.
-
03. Multiple generation options and advanced analytics.
It supports CSV downloads in addition to graph displays, enabling further analysis in Excel or BI tools.


![]()
Copyright (C) PORTERS Corporation All Rights Reserved.